A test of the performance prediction model
Contents
A test of the performance prediction model
import numpy as np
from collections import OrderedDict as odict
import pandas as pd
import matplotlib.pyplot as plt
import matplotlib.cm as cm
#(hardware name, number of nodes)
files = odict({})
files['i5'] = ('i5',1)
files['gtx1060'] = ('gtx1060',1)
files['skl_mpi1'] = ('skl',1)
files['skl_mpi2'] = ('skl',2)
files['skl_mpi4'] = ('skl',4)
files['knl_mpi1'] = ('knl',1)
files['knl_mpi2'] = ('knl',2)
files['knl_mpi4'] = ('knl',4)
files['p100nv_mpi1'] = ('p100',1)
files['p100nv_mpi2'] = ('p100',2)
files['p100nv_mpi4'] = ('p100',4)
files['v100nv_mpi1'] = ('v100',1)
files['v100nv_mpi2'] = ('v100',2)
files['v100nv_mpi4'] = ('v100',4)
# order by number of nodes to make labeling easier further down
files=odict(sorted(files.items(), key= lambda t : t[1][1]))
# count number of 1 nodes in dict
number=0
for k,v in files.items():
    if v[1]==1: number+=1
#setup plotting specifications
arch = {'knl':(cm.Greens, 450,0.5,0.33),'skl':(cm.Greys,200,0.5,0.75),   'p100':(cm.Blues,  550,0.5,0.43),
       'v100':(cm.Purples,850,0.5,0.85), 'i5':(cm.Wistia,30,0.5,0.79),'gtx1060':(cm.Oranges,155,0.5,0.70)}
intens={1:0.8, 2:0.6, 4:0.4}
Here, we setup the prediction model by giving the number of function calls and memory operations of each of the three types of primitive functions axpby, dot and dxdy
#(axpby,dot,dxdy)
latencies = odict()
latencies['scal'] = (1,0,0)
latencies['axpby'] = (1,0,0)
latencies['pointwiseDot'] = (1,0,0)
latencies['dot'] = (0,1,0)
latencies['dx'] = (0,0,1)
latencies['dy'] = (0,0,1)
latencies['arakawa'] = (3,0,6) # N = 9
latencies['cg'] = (6,2,6) # N = 13
latencies['avg']= (9,2,12) # N=23
memops = odict()
memops['scal']= (2,0,0)
memops['axpby']= (3,0,0)
memops['pointwiseDot']= (6,0,0)
memops['dot']= (0,2,0)
memops['dx']= (0,0,3)
memops['dy']= (0,0,3)
memops['arakawa'] = (16,0,18) # M = 34 -> M/N = 3.78
memops['cg'] = (20,4,18) # M = 42 -> M/N = 3.23
memops['avg'] = (36,4,36) # M = 76 -> M/N = 3.30
Let us read in the previously measured bandwidths and latencies
theo = pd.read_csv('performance.csv',delimiter=' ')
theo.set_index('arch',inplace=True)
theo.index.name = None
pd.set_option('display.float_format', lambda x: '%.2f' % x)
theo
| axpby_bw | axpby_bw_err | dot_bw | dot_bw_err | dxdy2_bw | dxdy2_bw_err | dxdy3_bw | dxdy3_bw_err | dxdy4_bw | dxdy4_bw_err | ... | axpby_lat_dist | axpby_lat_dist_err | dot_lat_shared | dot_lat_shared_err | dot_lat_dist | dot_lat_dist_err | dxdy_lat_shared | dxdy_lat_shared_err | dxdy_lat_dist | dxdy_lat_dist_err | |
|---|---|---|---|---|---|---|---|---|---|---|---|---|---|---|---|---|---|---|---|---|---|
| i5 | 29.99 | 0.19 | 9.31 | 0.04 | 27.79 | 2.97 | 29.12 | 2.84 | 25.58 | 1.49 | ... | NaN | NaN | 4.76 | 0.23 | NaN | NaN | 0.00 | 1.44 | NaN | NaN |
| gtx1060 | 157.05 | 0.06 | 26.50 | 0.10 | 130.63 | 0.40 | 111.23 | 1.11 | 83.82 | 13.83 | ... | NaN | NaN | 92.06 | 8.70 | NaN | NaN | 0.00 | 0.82 | NaN | NaN |
| skl | 206.71 | 5.87 | 192.05 | 18.31 | 181.56 | 35.38 | 161.75 | 13.00 | 118.06 | 18.39 | ... | 0.00 | 0.26 | 17.28 | 2.32 | 37.93 | 4.14 | 22.70 | 2.11 | 28.52 | 2.10 |
| knl | 393.15 | 22.19 | 141.36 | 6.63 | 239.04 | 17.02 | 172.69 | 26.80 | 126.04 | 18.59 | ... | 9.16 | 0.09 | 54.83 | 1.79 | 119.59 | 5.14 | 9.93 | 0.70 | 52.67 | 3.72 |
| p100 | 550.51 | 1.23 | 375.61 | 1.94 | 293.25 | 7.11 | 238.99 | 12.63 | 208.44 | 7.05 | ... | 0.00 | 0.27 | 50.89 | 7.06 | 51.67 | 0.59 | 26.23 | 0.05 | 54.40 | 0.35 |
| titanXp | 431.24 | 3.45 | 61.37 | 0.12 | 372.85 | 4.16 | 308.92 | 9.47 | 246.73 | 7.92 | ... | NaN | NaN | 44.37 | 5.15 | NaN | NaN | 2.38 | 0.57 | NaN | NaN |
| v100 | 846.42 | 0.95 | 610.15 | 5.99 | 794.43 | 20.52 | 735.42 | 33.02 | 696.49 | 15.14 | ... | 0.00 | 0.31 | 88.49 | 4.68 | 97.58 | 0.79 | 4.20 | 0.02 | 37.19 | 0.42 |
7 rows × 24 columns
#define conversion function
def toString(x):
    if pd.isnull(x) : return 'n/a'
    #string = '%.1f'% x
    string = '%d' %np.ceil(x)
    #if np.ceil(x)<100 : string = '0'+string
    if np.ceil(x)<10 : string = '0'+string
    return string
In the followin cell we construct a table that shows the average bandwiths and latencies among a typical selection of primitive algorithms.
lines=[]
#now compute and plot the prediction
archs = ['i5','gtx1060','skl','knl','titanXp','p100','v100']
for k in archs :
    line =[]
    for q,l in latencies.items():
        m = memops[q]
        M = m[0]+m[1]+m[2]
        for n in [2,3,4,5]:
            bw = [theo.loc[k,'axpby_bw'],theo.loc[k,'dot_bw'],theo.loc[k,'dxdy'+str(n)+'_bw']]
            err_bw = [theo.loc[k,'axpby_bw_err'],theo.loc[k,'dot_bw_err'],theo.loc[k,'dxdy'+str(n)+'_bw_err']]
            bandwidth = M/(m[0]/bw[0] + m[1]/bw[1] + m[2]/bw[2])
            err_bandwidth = bandwidth/(m[0]/bw[0] + m[1]/bw[1] + m[2]/bw[2])*np.sqrt(
                (m[0]/bw[0]**2*err_bw[0])**2 + (m[1]/bw[1]**2*err_bw[1])**2 + (m[2]/bw[2]**2*err_bw[2])**2  )
            line.append( toString( bandwidth)+" $\pm$ "+toString(err_bandwidth))
        L = l[0]+l[1]+l[2]
        for dist in ['shared','dist']:
            lat = [theo.loc[k,'axpby_lat_'+dist], theo.loc[k,'dot_lat_'+dist], theo.loc[k,'dxdy_lat_'+dist]]
            err_lat = [theo.loc[k,'axpby_lat_'+dist+'_err'], theo.loc[k,'dot_lat_'+dist+'_err'], theo.loc[k,'dxdy_lat_'+dist+'_err']]
            latency = ( l[0]*lat[0]+ l[1]* lat[1] + l[2]*lat[2])/L #in us
            err_latency = np.sqrt( (l[0]*err_lat[0])**2 + (l[1]*err_lat[1])**2 + (l[2]*err_lat[2])**2 )/L
            if (dist == 'dist') and ((k == 'i5') or (k=='gtx1060') or (k=='titanXp')):
                line.append(toString( None))
            else: line.append(toString( latency)+" $\pm$ "+toString(err_latency))
        #print(q,latency)

    lines.append(line)
index = archs
tuples=[]
for p in latencies.keys():
    for q in ['B(P=2) [GB/s]','B(P=3) [GB/s]','B(P=4) [GB/s]','B(P=5) [GB/s]',
              '$T_{lat}(1)$ [$\mu$s]','$T_{lat}(4)$ [$\mu$s]']:
        tuples.append((p,q))


cols=pd.MultiIndex.from_tuples(tuples)

avg = pd.DataFrame(lines, index=index, columns=cols)
#avg.sort_values(by=('avg','B(P=2) [GB/s]'), inplace=True)
#avg.loc[:,('cg','size')]=(avg['cg']['P=3']/1e3*9/34
#                              )*avg['cg']['lat 4 [$\mu$s]']
pd.set_option('display.float_format', lambda x: '%.0f' % x)
#avg.loc['i5',('avg','$T_{lat}(4)$ [$\mu$s]')]='n/a'
#avg.loc['gtx1060',('avg','$T_{lat}(4)$ [$\mu$s]')]='n/a'
filename='avg.tex'
with open(filename, 'wb') as f:
    f.write(bytes(avg['avg'].to_latex(
        escape=False,column_format='lp{1.5cm}p{1.5cm}p{1.5cm}p{1.5cm}p{1.2cm}p{1.2cm}',
                               bold_rows=True),'UTF-8'))
avg['avg']
| B(P=2) [GB/s] | B(P=3) [GB/s] | B(P=4) [GB/s] | B(P=5) [GB/s] | $T_{lat}(1)$ [$\mu$s] | $T_{lat}(4)$ [$\mu$s] | |
|---|---|---|---|---|---|---|
| i5 | 26 $\pm$ 02 | 27 $\pm$ 02 | 26 $\pm$ 01 | 23 $\pm$ 02 | 01 $\pm$ 01 | n/a |
| gtx1060 | 116 $\pm$ 01 | 108 $\pm$ 01 | 94 $\pm$ 09 | 85 $\pm$ 12 | 09 $\pm$ 01 | n/a |
| skl | 194 $\pm$ 20 | 183 $\pm$ 09 | 153 $\pm$ 15 | 147 $\pm$ 07 | 14 $\pm$ 02 | 19 $\pm$ 02 |
| knl | 281 $\pm$ 13 | 232 $\pm$ 24 | 188 $\pm$ 20 | 160 $\pm$ 18 | 13 $\pm$ 01 | 42 $\pm$ 02 |
| titanXp | 310 $\pm$ 02 | 287 $\pm$ 04 | 259 $\pm$ 05 | 230 $\pm$ 21 | 06 $\pm$ 01 | n/a |
| p100 | 383 $\pm$ 06 | 336 $\pm$ 12 | 306 $\pm$ 08 | 267 $\pm$ 21 | 22 $\pm$ 01 | 33 $\pm$ 01 |
| v100 | 806 $\pm$ 11 | 776 $\pm$ 18 | 755 $\pm$ 09 | 691 $\pm$ 43 | 11 $\pm$ 01 | 28 $\pm$ 01 |
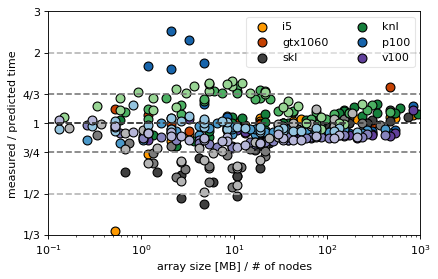
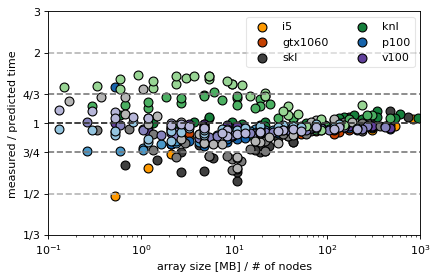
In the following we compare the predicted with the measured values for the Arakawa and CG algorithm
#now compute and plot the prediction
del latencies['avg']
del memops['avg']
for n in ['arakawa','cg'] :#latencies.keys():
    fig,ax=plt.subplots(1,1,figsize=(6,3.7),dpi= 80, facecolor='w', edgecolor='k')
    xs = np.array([0.1,1000])
    ys = np.array([1.0,1.0])
    for frac in [1.0,4/3,8/4]:
        plt.plot(xs,frac*ys,ls='--',color=cm.Greys(0.8/frac))
        plt.plot(xs,1/frac*ys,ls='--',color=cm.Greys(0.8/frac))

    for f, v in files.items() :#{'knl_mpi2':('knl',2)}.items():
        df=pd.read_csv('benchmark_'+f+'.csv', delimiter=' ')
        #add size and get rid of non-relevant columns
        df.insert(0,'size', 8*df['n']*df['n']*df['Nx']*df['Ny']/1e6/v[1])
        dfr = df[['n','Nx','Ny','size']+list(memops.keys())]
        #compute mean and standard derivation of 'same' groups
        dfr=dfr.groupby(['n', 'Nx','Ny','size']).mean()
        dfr=dfr.reset_index(level=['n','Nx','Ny','size'])

        dfr['FirstLevel']='measured'
        dfr.columns=pd.MultiIndex.from_product([dfr.columns,['measured']])
        del dfr['FirstLevel']

        dfr['dxdy_bw'] = dfr.apply(
            lambda row: theo.loc[v[0],'dxdy'+str(row['n','measured'].astype(int))+'_bw'], axis=1)

        dxdystring = 'dxdy_lat_shared'
        dotstring = 'dot_lat_shared'
        if v[1] > 1 :
            dxdystring = 'dxdy_lat_dist'
            dotstrint = 'dot_lat_dist'
        for q,l in latencies.items():
            m = memops[q]
            dfr.loc[:,(q,'predicted')] = (
                                    ( l[0]*theo.loc[v[0],'axpby_lat_shared']+
                                      l[1]*theo.loc[v[0],dotstring] +
                                      l[2]*theo.loc[v[0],dxdystring]
                                    )*1e-6+
                                    (m[0]/theo.loc[v[0],'axpby_bw'] + m[1]/theo.loc[v[0],'dot_bw'] + m[2]/dfr['dxdy_bw',''])
                                       *dfr[('size','measured')]/1000)
            dfr.loc[:,(q,'meas/pred')]=dfr[(q,'measured')]/dfr[(q,'predicted')]

        toPlot = dfr[n].join(dfr[('size')],rsuffix='_size')
        toPlot.plot(kind='scatter',ax=ax,color=arch[v[0]][0](intens[v[1]]),edgecolors='k',
                     x='measured_size', y='meas/pred',label=v[0],s=64)
    handles, labels = plt.gca().get_legend_handles_labels()
    handles = handles[0:number]; labels = labels[0:number]

    #plt.plot(xs,ys)


    plt.legend(handles, labels, loc='upper right',ncol=2,
               scatterpoints=1,fontsize='medium',framealpha=0.5)
    plt.xscale('log')
    plt.xlim(xs[0],xs[1])
    #plt.xlabel('measured time in s')
    plt.xlabel('array size [MB] / # of nodes')
    plt.ylabel('measured / predicted time')
    plt.yscale('log', subsy=[0])#log scale, turn minor ticks off
    plt.ylim(1/3,3)
    plt.yticks([1/3,0.5,0.75,1,1.33,2,3],['1/3','1/2','3/4',1,'4/3',2,3])
    #plt.title(n)
    plt.savefig(n+'.pdf',bbox_inches='tight')
/tmp/ipykernel_11025/1666577502.py:60: MatplotlibDeprecationWarning: The 'subsy' parameter of __init__() has been renamed 'subs' since Matplotlib 3.3; support for the old name will be dropped two minor releases later.
  plt.yscale('log', subsy=[0])#log scale, turn minor ticks off
/tmp/ipykernel_11025/1666577502.py:60: MatplotlibDeprecationWarning: The 'subsy' parameter of __init__() has been renamed 'subs' since Matplotlib 3.3; support for the old name will be dropped two minor releases later.
  plt.yscale('log', subsy=[0])#log scale, turn minor ticks off


Observations
plots show deviations from the predicted timing
the goal of the discussion is to prove that the time formula is correct because then performance can be discussed analytically and makes “scaling” plots somewhat obsolete
there seems to be a systematic overestimation of the knl MPI scaling (is this the fault of the implemenation? What is wrong there?)
skl and i5 for small sizes are mostly faster than predicted because cache effects are not included in the model
there seems to a drop in efficiency in GPUs when the problem size nears the full size of the GPU memory (last single node points in GTX, P100 and V100)